After several weeks of conversion and calculation, I present Pinole’s budget in spreadsheet form, along with associated graphs! Feel free to use this spreadsheet or the graphs so long as you grant credit to city staff for creating the budget and me for turning it into a spreadsheet. Before I go into the graphs, I’d like to note that the Sewer Treatment Plant rebuild falls under Public Works, and accounts for the vast majority of Pinole’s bound income and a majority of Public Work’s expenses.
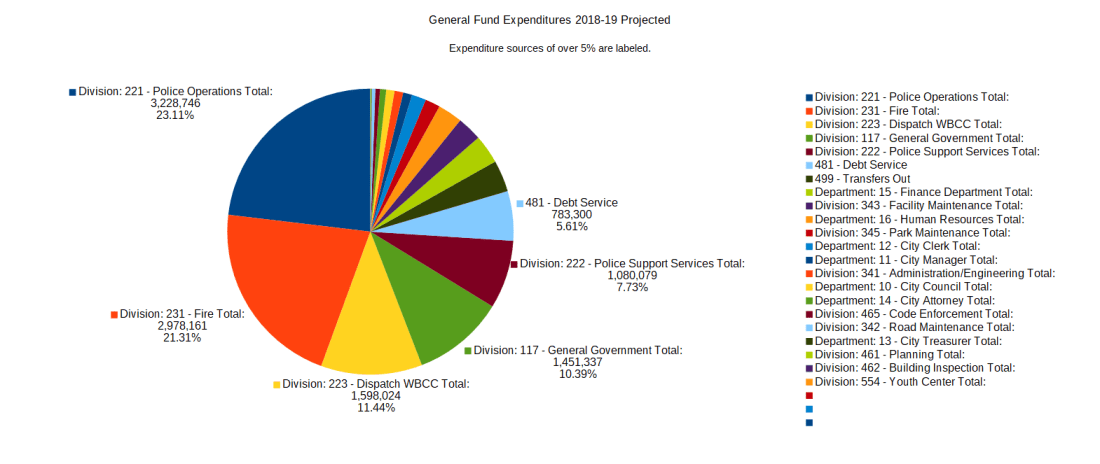
I will begin with graphs from the general fund info, but these graphs are incomplete. There are significant bound and unbound revenue sources as well as expenditure sources outside of the general fund, and my graphs accounting for all the funds follow the general fund charts below. First, pie charts of Pinole’s general fund revenue and expenditures for 2018-19 projected.

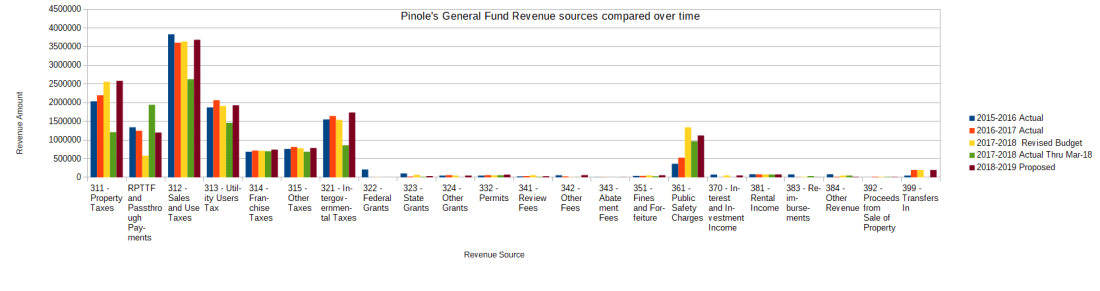
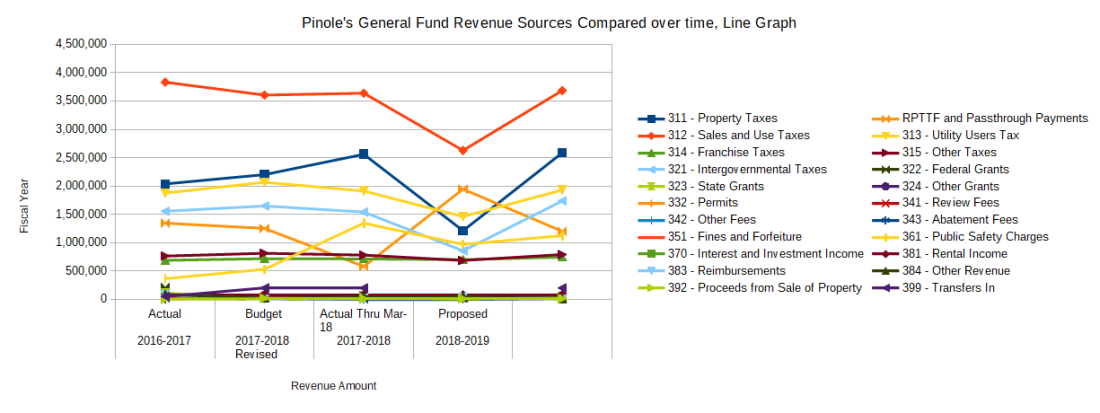
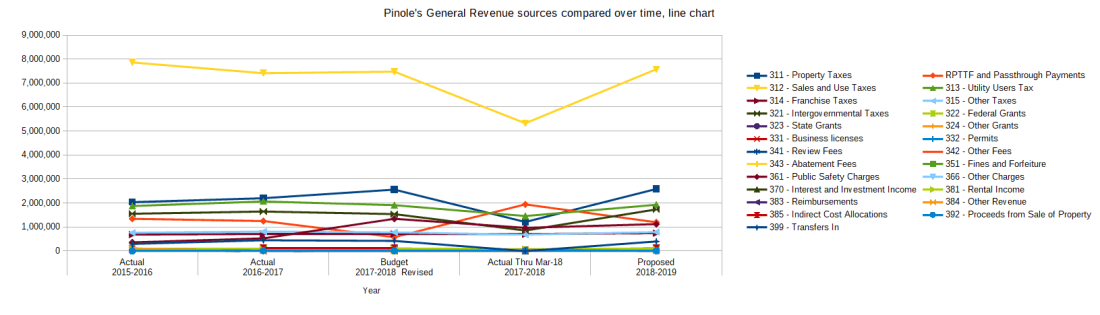
Then we move on to a comparison of general fund revenue sources over time in bar and line chart forms.
However, there are significant revenue and expenditure sources outside of the general fund. Therefore, we next have general and bound revenue for Pinole 2018-19 in pie graphs, followed by expenditures by department. Note that Sales and Use Taxes make up a full 40% of the city’s anticipated unbound revenue, and the Utility Users Tax makes up another 10%. Bound revenue is overwhelmingly (70%) linked to the sewer plant rebuild.
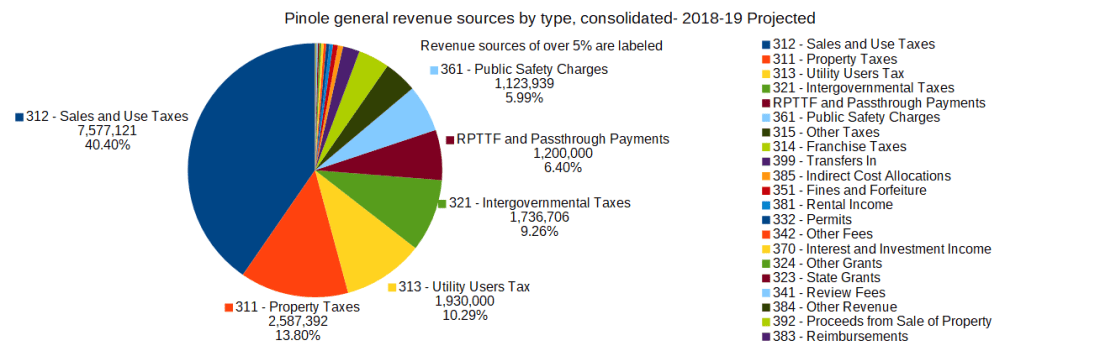
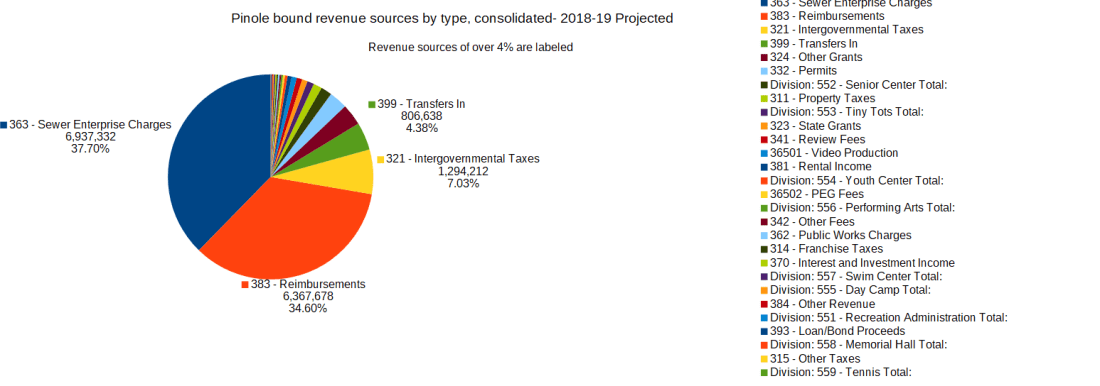
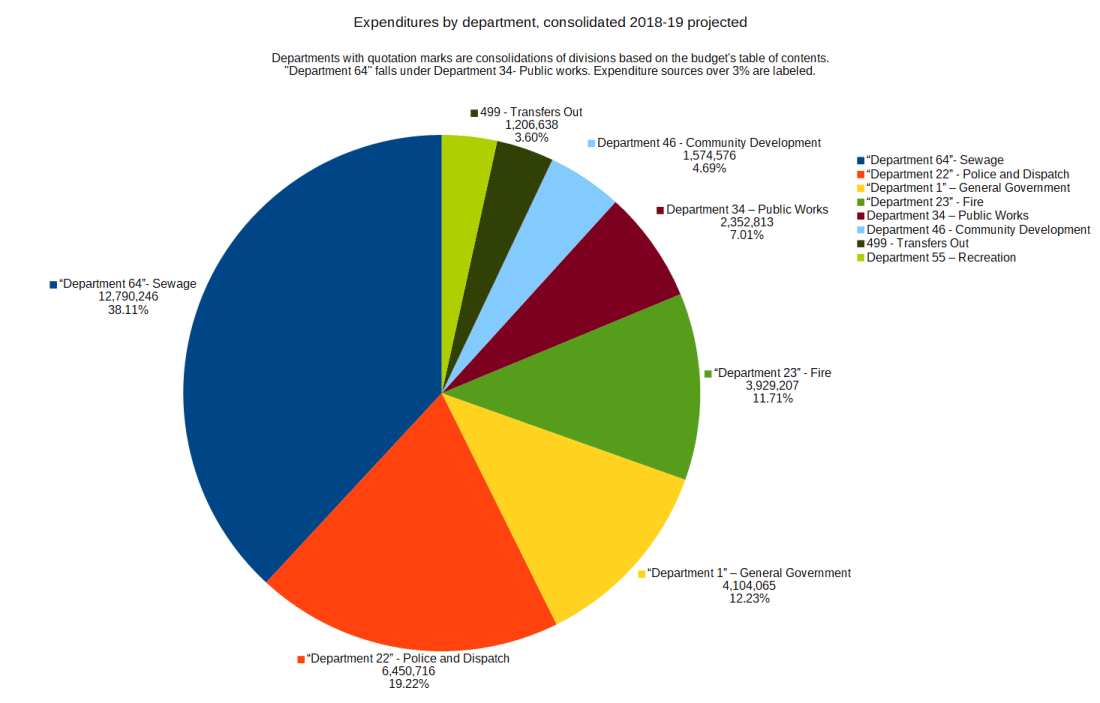
The sewer plant rebuild is noted in its own category, but it belongs under Public Works. As noted in the graph, departments with quotation marks are made from divisions in the budget based on the table of content’s structuring.
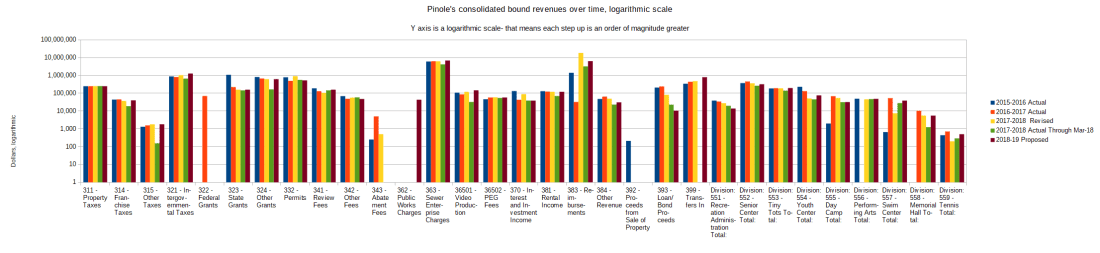
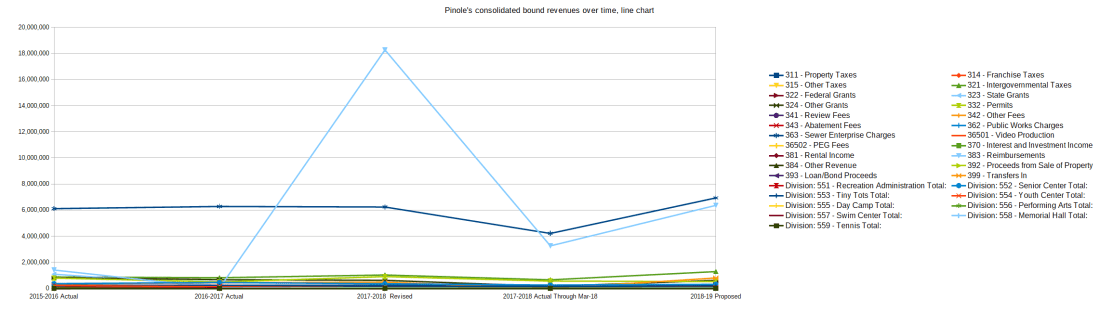
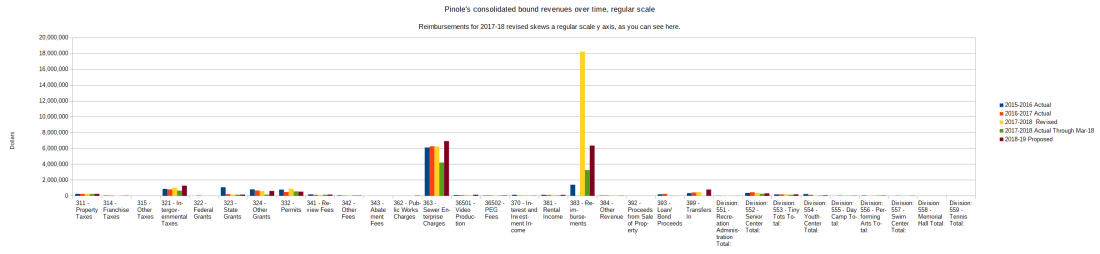
Finally, we have a comparison of overall revenue sources across time, general and bound in bar and line graphs. Due to the 18,277,900 dollar reimbursement in 2017-18 revised (see page B-1), the bound revenue bar graph is provided in logarithmic form, as that amount is a sufficient outlier to make a normal bar graph much less useful.


One thought on “Pinole Budget Graphs”